The current surge in gold appears to be mainly technical in nature. The good news for Gold Bugs is that it's barely started.
The great news is reserved for Gold Stock Bugs, and that news is that the miners look set to dramatically outperform gold (and everything) in the coming weeks and months.
Let's take a look at some very interesting charts:
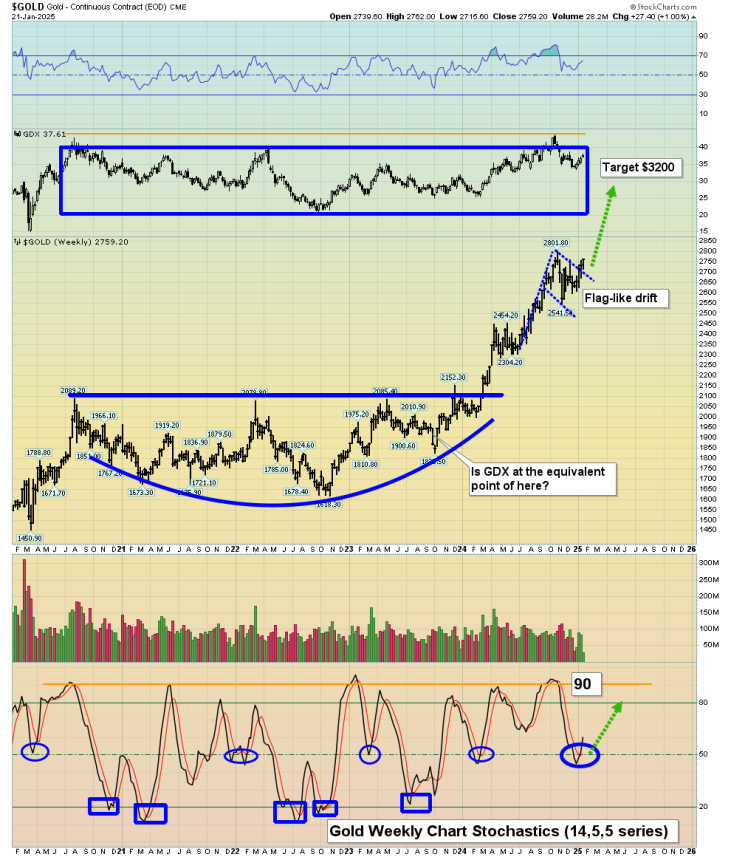
On this weekly chart, Stochastics (14,5,5 series) is on a momentum zone buy signal, and gold is breaking upside from a flag-like rectangular drift.
The target of that pattern is about $3200.
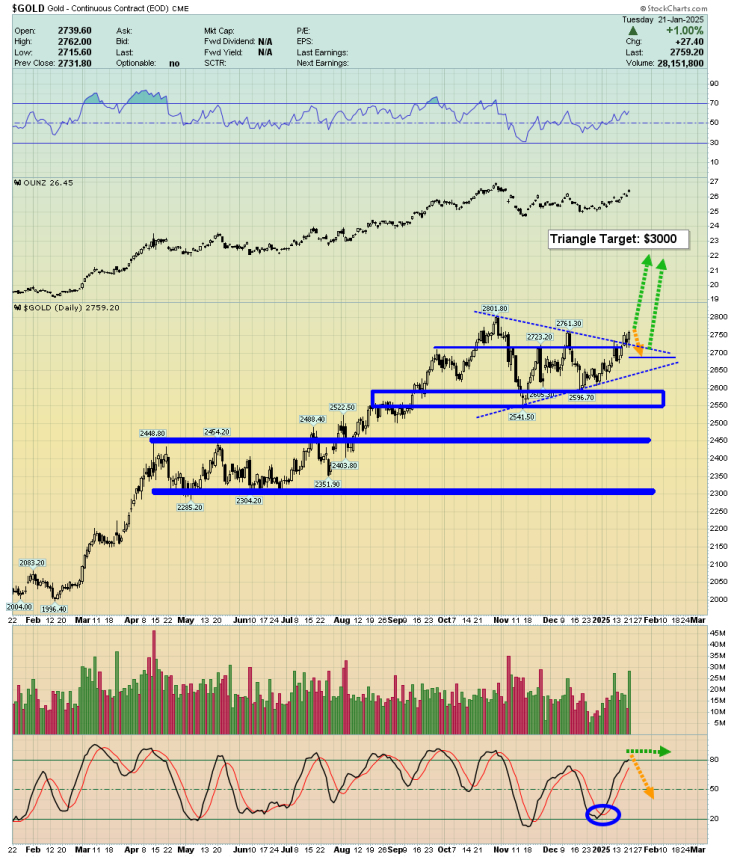
While gold is a tad overbought in the short term, a bull triangle breakout is in play, and it targets a surge to the $3000 round number zone.
Clearly, most technical traffic lights for gold are green!
Compared to other fiats, the dollar looks shaky at best. Here's a look at it basis the daily chart:
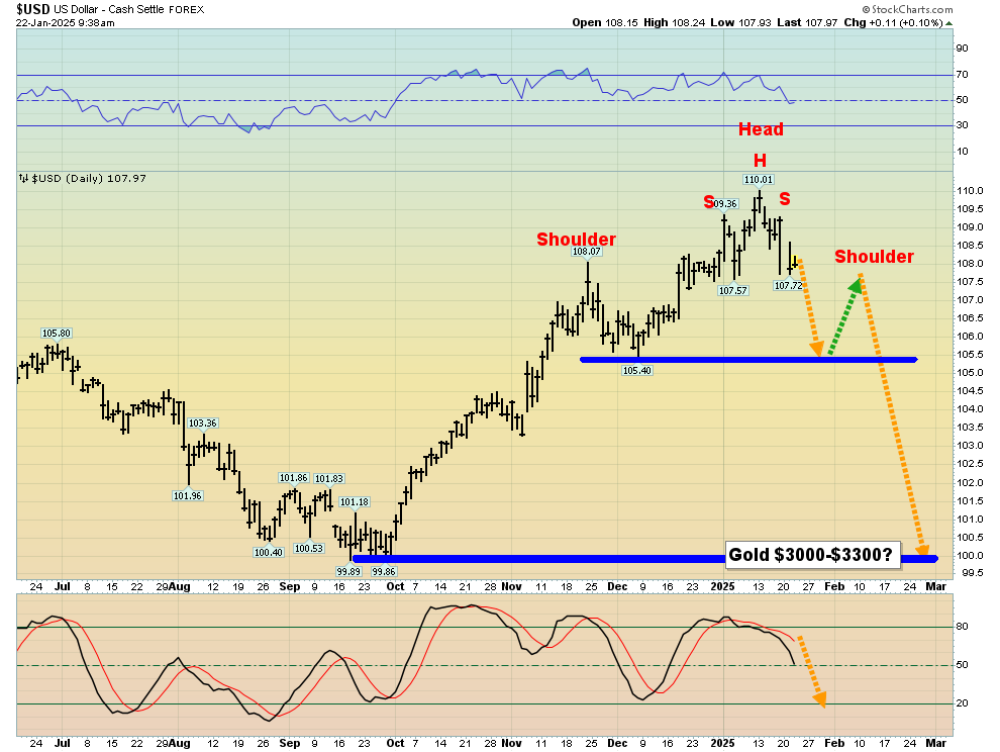
A small H&S top pattern has formed, and it could (and likely does) become the head of a much bigger one. A tumble back to par is becoming my main scenario, and that could be supportive for gold $3000-$3300.
What about silver? Let's take a look at the chart:
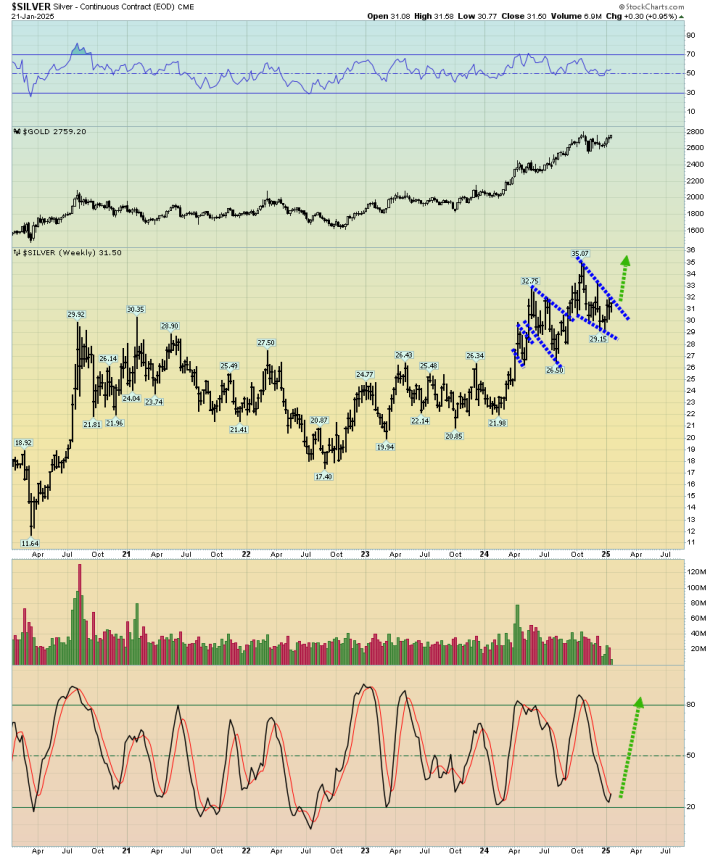
Silver has been rising in a series of bullish rectangular drifts. It hasn't been as exciting as gold, but the latest drift has bull wedge characteristics.
Given that fact and the strong Stochastics buy signal on this weekly chart, silver bugs could soon be handsomely rewarded for their patience.
What about the new U.S. government? Well, as always, there are a lot of promises, but in the end, the big picture, as expected, is a refusal to jettison the nation's fiat currency and replace it with gold.
That refusal means more debt is coming, probably a lot more, and with valuation ratios in nosebleed territory for the stock market, it's only a matter of time (and perhaps not much time) before major money managers start to focus on the miners.
On that exciting note, here's the weekly chart of the HUI gold stocks index:
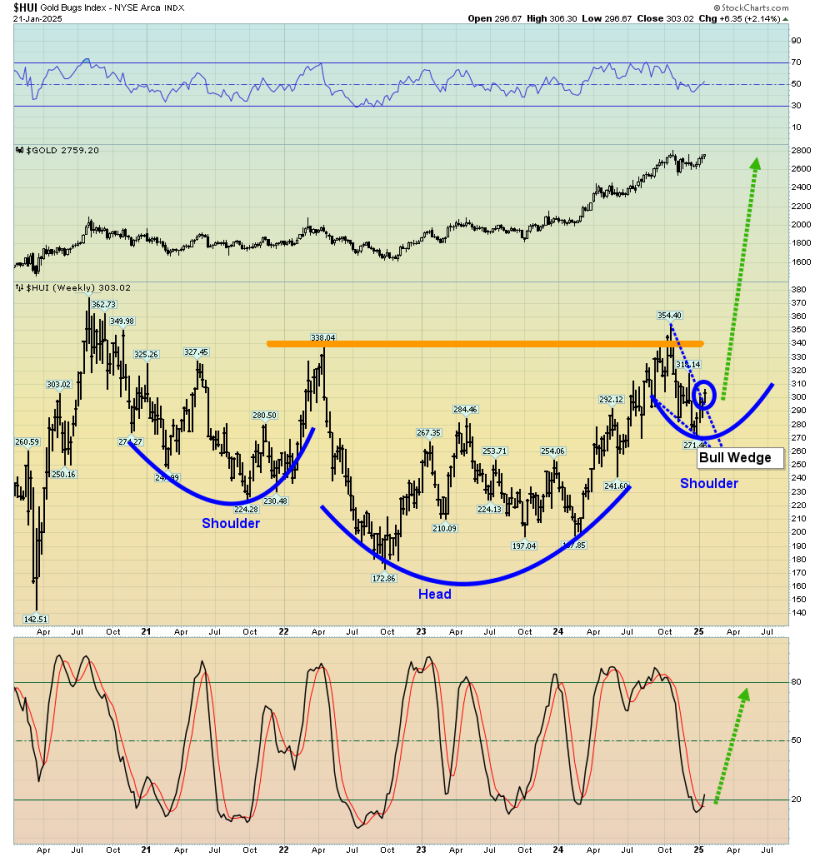
A loose but truly massive inverse H&S pattern is in play, and the right shoulder takes the form of a fabulous bull wedge! The cake is iced with this week's upside breakout from the wedge.
Interestingly, in Oct 2010, I warned gold stock bugs that their rampant buying at that time was best defined as a "loss of sanity."
The current market appears to be the exact opposite of that: Prices are rising, and yet gold stock bugs, in general, seem disillusioned and afraid to buy. The bottom gold stocks line:
It could be another loss of sanity zone, but an outrageously bullish one: Gold stock investors seem more focused on changes in the U.S. elementary school curriculum and a ditch in Panama than on what is quickly becoming . . . Mining stock glory.
Here's a look at more of that glory:
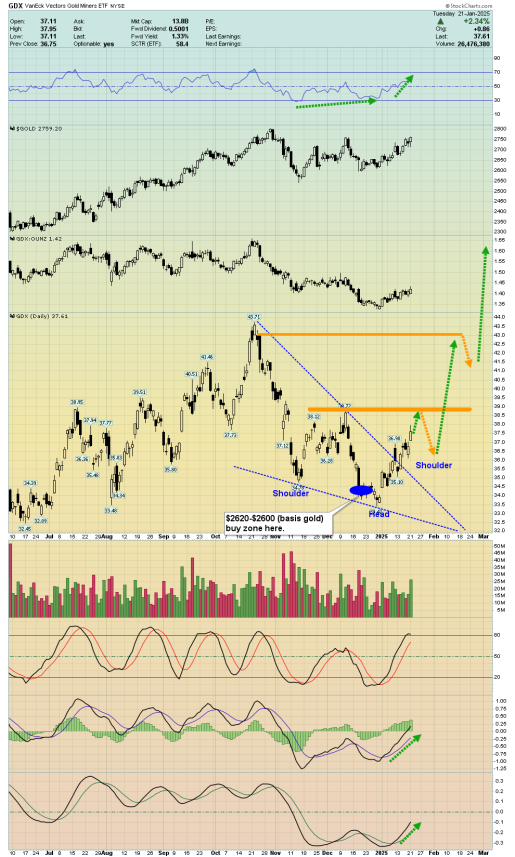
This GDX daily chart looks technically spectacular. The price has surged from my buy zone at $34. . .
And the performance so far has likely only barely scratched the surface of the "action of awesomeness" that lies ahead for eager gold stock enthusiasts.
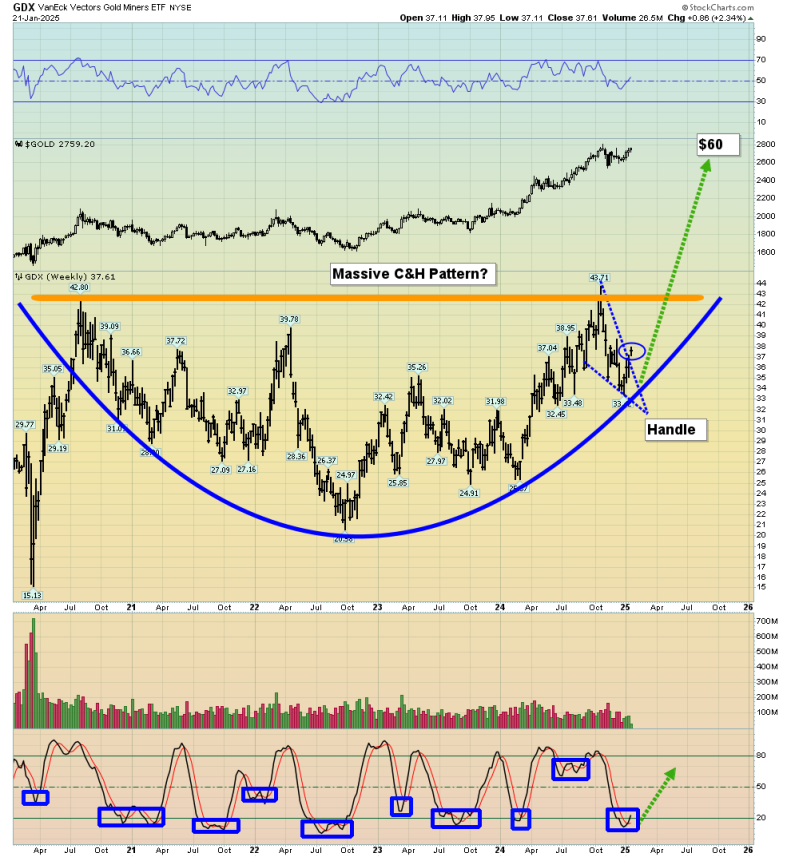
Wow! A massive 14,5,5 series Stochastics buy signal is in play, heralding a bull wedge breakout.
That wedge is the handle of a massive C&H pattern, and while disillusioned gold stock investors of the past wait for the U.S. government (and Godot?) to build them new airports, roads, and bridges with mountains of debt, a veritable cornucopia of mine stocks look like gold bull era starships, staging a "rip snort" charge towards outer price space . . . and I'll dare to suggest they probably not only go there, but probably stay there for decades of time.
Here's an exciting individual stock, Agnico Eagle Mines Ltd. (AEM:TSX; AEM:NYSE).
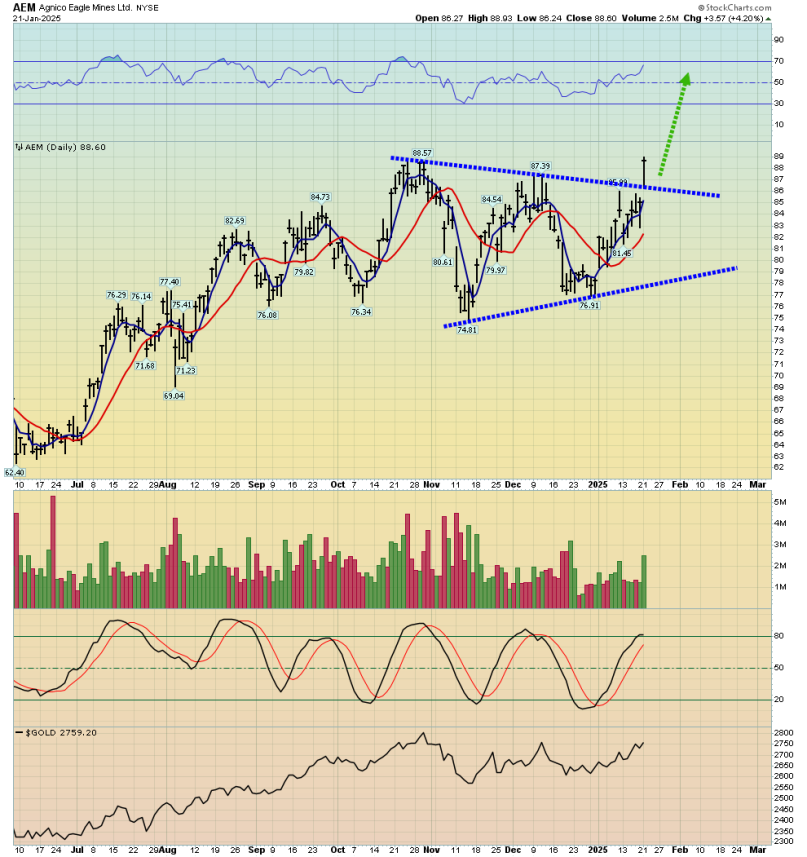
Agnico is one of those starship-like stocks. Note the fantastic triangle pattern breakout defined by Tuesday's market action and close. I consider it a no-brainer buy for momentum investors here and now.
The weekly chart is even more stunning, and here it is:
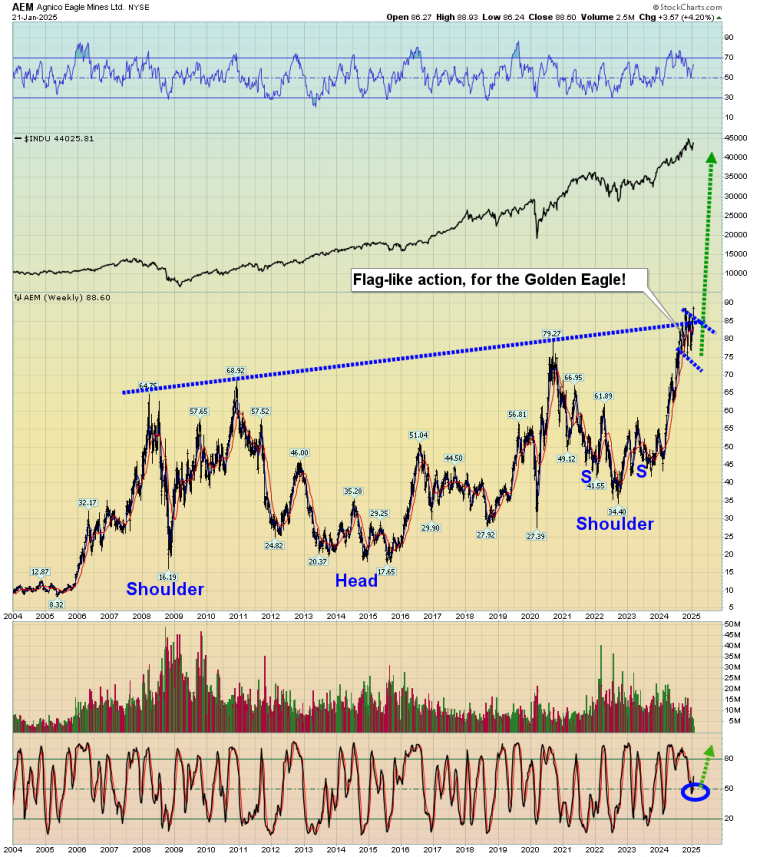
It's a historic moment in time on this weekly chart, because investors are looking at a breakout from one of the largest bull continuation patterns in the history of markets.
What about the juniors? I cover those in a separate "juniors only" newsletter and I'm outrageously bullish on the sector. I write that newsletter about twice a week, and at just $199/12mths it's an investor favourite. I'm doing a special pricing this week of $169 for 14mths. Click this link or send me an email if you want the offer and I'll get you onboard. Thank you.
Here's the CDNX daily chart:
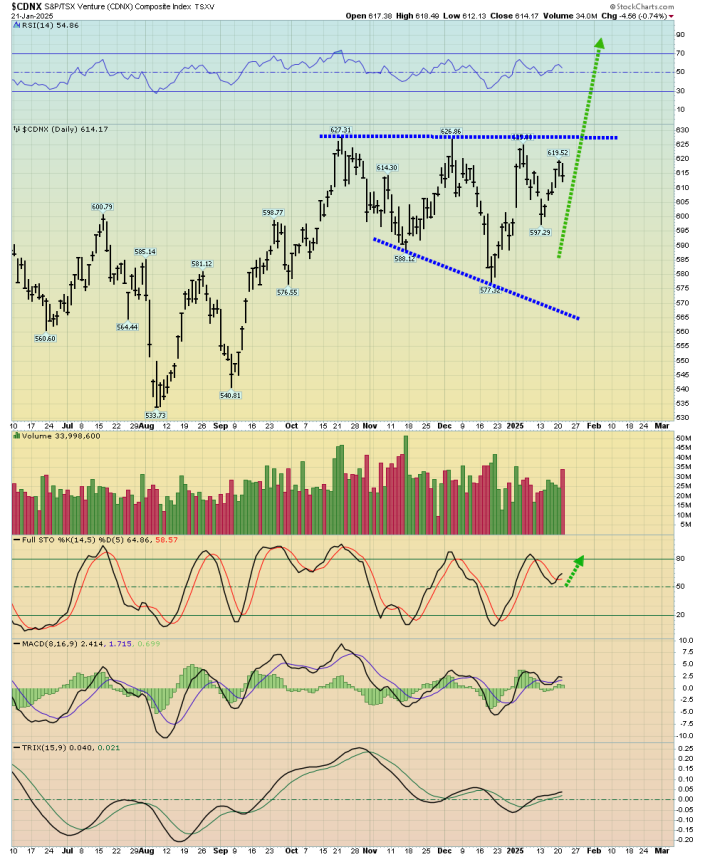
A move above 630 should be the catalyst for a massive bull run, and many individual mines seem to already be in "space helmets on" mode.
Here's a look at Tuktu Resources Ltd. (TUK:TSX.V; JAMGF:OTCMKTS), which is an Alberta oil play:
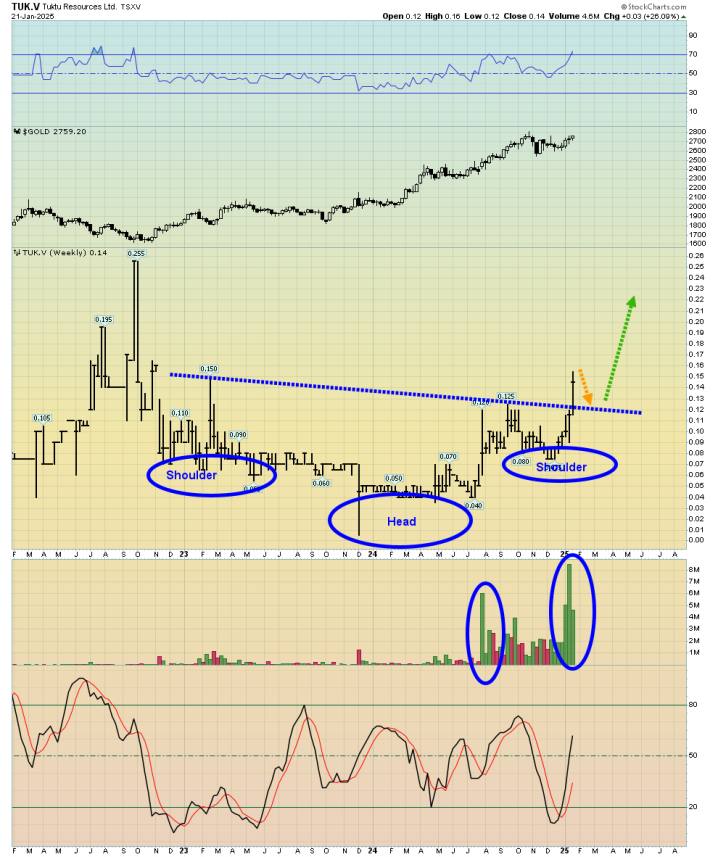
The U.S. government's renewed focus on fossil fuels bodes well for the company, and note the huge volume coming into the stock. A solid inverse H&S pattern is in play… and it should trade nicely higher in the coming year!
Special Offer for Streetwise Readers: Please send me an email to [email protected] and I'll send you my free "Junior Gold Stock Thunder!" report. I highlight CDNX miners trading under $1/share that are checking some key "Rally time is here!" technical boxes. Significant buy and sell zones are noted in this report.
| Want to be the first to know about interesting Silver, Gold and Oil & Gas - Exploration & Production investment ideas? Sign up to receive the FREE Streetwise Reports' newsletter. | Subscribe |
Important Disclosures:
- As of the date of this article, officers and/or employees of Streetwise Reports LLC (including members of their household) own securities of Agnico Eagle Mines Ltd.
- Stewart Thomson: I, or members of my immediate household or family, own securities of: GDX. I determined which companies would be included in this article based on my research and understanding of the sector.
- Statements and opinions expressed are the opinions of the author and not of Streetwise Reports, Street Smart, or their officers. The author is wholly responsible for the accuracy of the statements. Streetwise Reports was not paid by the author to publish or syndicate this article. Streetwise Reports requires contributing authors to disclose any shareholdings in, or economic relationships with, companies that they write about. Any disclosures from the author can be found below. Streetwise Reports relies upon the authors to accurately provide this information and Streetwise Reports has no means of verifying its accuracy.
- This article does not constitute investment advice and is not a solicitation for any investment. Streetwise Reports does not render general or specific investment advice and the information on Streetwise Reports should not be considered a recommendation to buy or sell any security. Each reader is encouraged to consult with his or her personal financial adviser and perform their own comprehensive investment research. By opening this page, each reader accepts and agrees to Streetwise Reports' terms of use and full legal disclaimer. Streetwise Reports does not endorse or recommend the business, products, services or securities of any company.
For additional disclosures, please click here.
Stewart Thomson Disclosures
Stewart Thomson is no longer an investment advisor. The information provided by Stewart and Graceland Updates is for general information purposes only. Before taking any action on any investment, it is imperative that you consult with multiple properly licensed, experienced and qualified investment advisors and get numerous opinions before taking any action. Your minimum risk on any investment in the world is: 100% loss of all your money. You may be taking or preparing to take leveraged positions in investments and not know it, exposing yourself to unlimited risks. This is highly concerning if you are an investor in any derivatives products. There is an approx $700 trillion OTC Derivatives Iceberg with a tiny portion written off officially. The bottom line:
Are You Prepared?


