
Most traders I have been talking with are feeling the same thing. Something big is brewing for the equities market but most do not want to get heavily involved until there is a clear direction. The broad market has been consolidating for almost three months and it's important to remember that the larger the consolidation, the bigger the move.
Also, the biggest and best moves come from failed patterns. So is the big head-and-shoulders pattern on the SP500 which everyone is yelling about (the sky is falling) really going to happen, or is this the BIG fake-out? Only time will tell; either way I will be sure to catch some of it.
Below are a few charts pointing out patterns and trends which could provide some opportunity in the coming days or weeks.
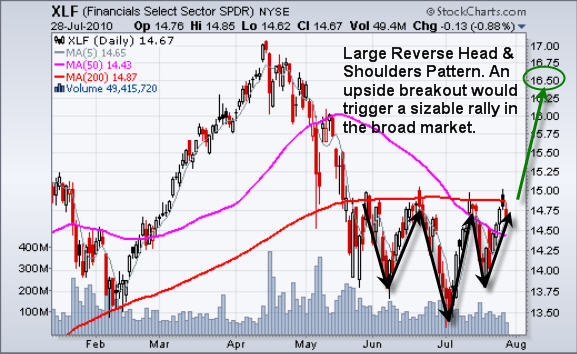
XLF—Financial Sector ETF
Financials play a large roll in moving the major indexes, so if this reverse head-and-shoulders pattern breaks out to the upside, then the indexes should rally and XLF ETF could reach its measured move of $16.50.
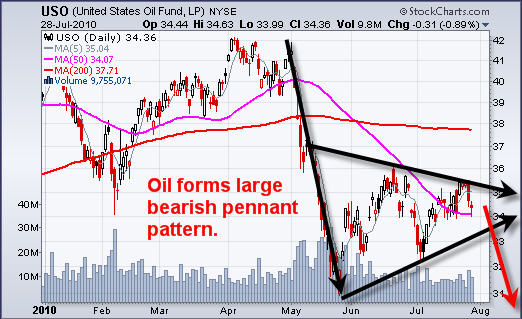
USO—Crude Oil Fund
Crude oil almost looked like it was going to breakout and mover higher this week but sellers jumped in sending it lower once again. The daily chart shows a large bearish pennant which is known as a continuation pattern. So it looks as though we should see lower prices for oil.
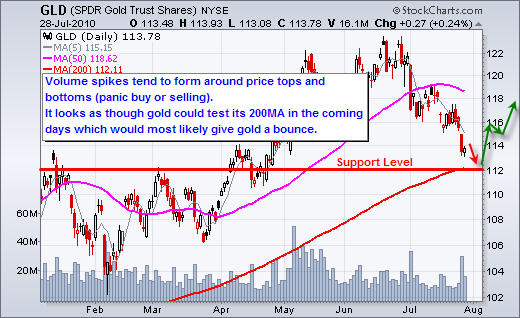
GLD—Gold Bullion ETF
Gold has been sliding lower for several weeks now and it looks to be showing selling exhaustion. The 5th wave down with the volume spike indicates panic-selling as investors cannot hold onto those positions any longer and exit. This is a bullish sign for gold. Also, we are seeing gold fall deep into a support level along with the 200-day moving average.
Mid-Week Financials, Oil and Gold Trading Conclusion:
In short, the equities market is in limbo until a clear trend is established. If the financial sector breaks out to the upside, then we should see a sizable rally. As for oil, it looks to be trading near the middle of its range, but is still in a downtrend overall. Gold is almost looking ready for a bounce, but I am waiting for more confirmation before jumping on the wagon.
If you would like to receive my Trading Analysis and ETF Alerts, try my subscription service, which has a 30 day money back guarantee: www.thegoldandoilguy.com/specialoffer/signup
Chris Vermeulen
Also, the biggest and best moves come from failed patterns. So is the big head-and-shoulders pattern on the SP500 which everyone is yelling about (the sky is falling) really going to happen, or is this the BIG fake-out? Only time will tell; either way I will be sure to catch some of it.
Below are a few charts pointing out patterns and trends which could provide some opportunity in the coming days or weeks.
XLF—Financial Sector ETF
Financials play a large roll in moving the major indexes, so if this reverse head-and-shoulders pattern breaks out to the upside, then the indexes should rally and XLF ETF could reach its measured move of $16.50.
USO—Crude Oil Fund
Crude oil almost looked like it was going to breakout and mover higher this week but sellers jumped in sending it lower once again. The daily chart shows a large bearish pennant which is known as a continuation pattern. So it looks as though we should see lower prices for oil.
GLD—Gold Bullion ETF
Gold has been sliding lower for several weeks now and it looks to be showing selling exhaustion. The 5th wave down with the volume spike indicates panic-selling as investors cannot hold onto those positions any longer and exit. This is a bullish sign for gold. Also, we are seeing gold fall deep into a support level along with the 200-day moving average.
Mid-Week Financials, Oil and Gold Trading Conclusion:
In short, the equities market is in limbo until a clear trend is established. If the financial sector breaks out to the upside, then we should see a sizable rally. As for oil, it looks to be trading near the middle of its range, but is still in a downtrend overall. Gold is almost looking ready for a bounce, but I am waiting for more confirmation before jumping on the wagon.
If you would like to receive my Trading Analysis and ETF Alerts, try my subscription service, which has a 30 day money back guarantee: www.thegoldandoilguy.com/specialoffer/signup
Chris Vermeulen


