
Spot crude oil prices received a bounce in yesterday's trading. This was the first gain for the commodity in almost 10 days. The rise in the price coincided with both positive fundamental data along with a technical boundary that the commodity ran into due to the recent sharp decline in the spot price. Yesterday's rise in the price helped keep the recent bullish trend intact while setting up a buying opportunity.
The price of spot crude oil rose yesterday to a high of $77 before falling back to close up at $76.20. The 0.8% gain came after an opening price of $75.57.
Recent crude oil prices have been closely tracking the movements of the equity markets. The near-term trend for the DJIA has turned lower but yesterday the widely followed stock index finished the day higher by 1.60%.
Spot crude oil's sharp decline has made for a potential opportunity for traders to enter into the market long on the commodity. After falling $7, the value drop failed to breach below the trendline that began on May 25th.
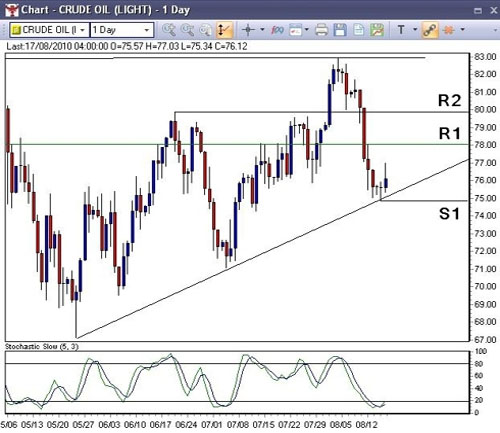
Technical indicators show the price may be in line for further gains. The bearish correction stalled during Friday's trading and also failed to breach below the short-term rising trendline, signaling the bullish uptrend is still valid.
A buy signal is also shown on the daily chart. The Slow Stochastic oscillator displays a bullish cross, indicating the next price move may be to the upside.
Resistance for spot crude trading is at $78 (R1), followed by $79.90 (R2) and the August high at $83. Support comes in at the low of this week's trading at $74.85 (S1), just below the rising trendline. Should the price close below this support level, it would signal a shift in the trend to the downside.
The price of spot crude oil rose yesterday to a high of $77 before falling back to close up at $76.20. The 0.8% gain came after an opening price of $75.57.
Recent crude oil prices have been closely tracking the movements of the equity markets. The near-term trend for the DJIA has turned lower but yesterday the widely followed stock index finished the day higher by 1.60%.
Spot crude oil's sharp decline has made for a potential opportunity for traders to enter into the market long on the commodity. After falling $7, the value drop failed to breach below the trendline that began on May 25th.
Technical indicators show the price may be in line for further gains. The bearish correction stalled during Friday's trading and also failed to breach below the short-term rising trendline, signaling the bullish uptrend is still valid.
A buy signal is also shown on the daily chart. The Slow Stochastic oscillator displays a bullish cross, indicating the next price move may be to the upside.
Resistance for spot crude trading is at $78 (R1), followed by $79.90 (R2) and the August high at $83. Support comes in at the low of this week's trading at $74.85 (S1), just below the rising trendline. Should the price close below this support level, it would signal a shift in the trend to the downside.


